USDT Dominance
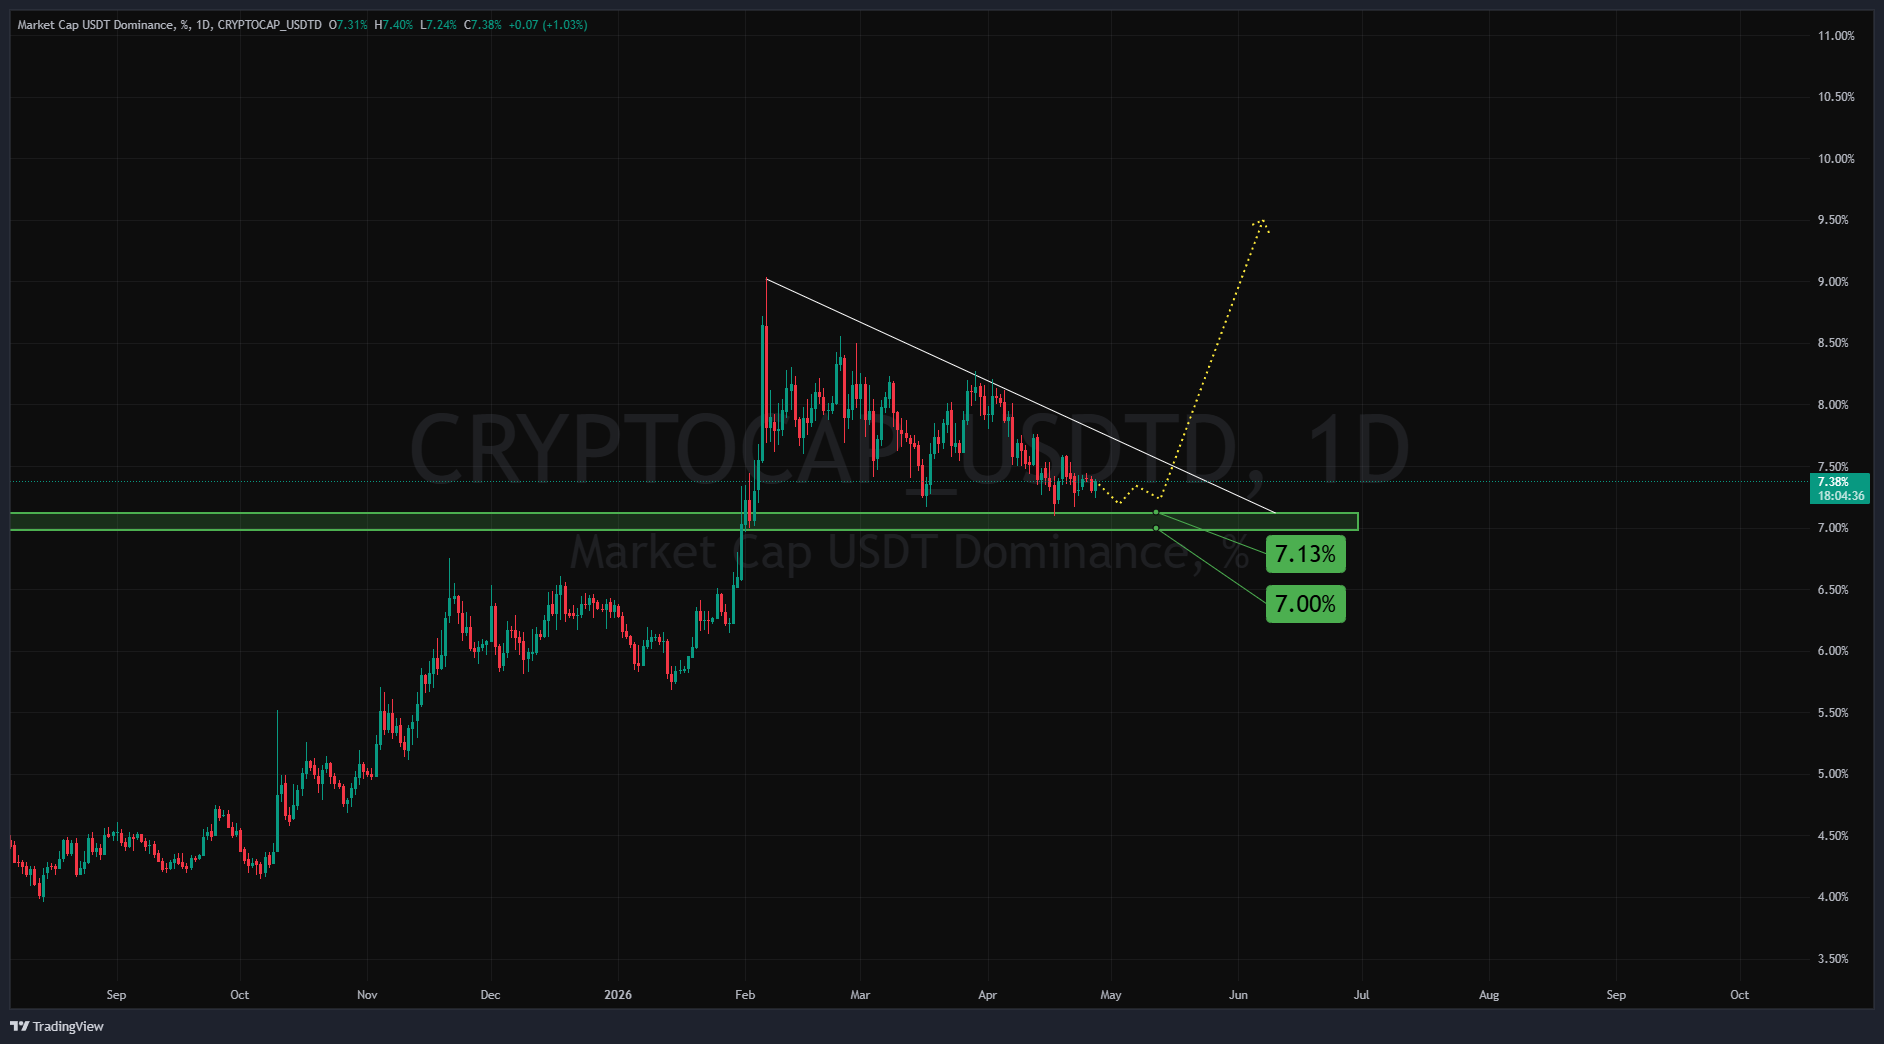
This chart represents "USDT Dominance Market Cap," which indicates the share of Tether's (USDT) market value within the total cryptocurrency market. It is displayed on a daily timeframe (1D).Now, let’s move to the technical analysis:Analysis of USDT Dominance Chart: Overall Trend: The chart shows that from late last year (around November 2025) until now, USDT dominance has been in an uptrend. After reaching a peak around February 2026, it has entered a downward channel. The upper white line represents the ceiling of this channel.
Support and Resistance Levels:
Key Support: A significant green support zone is visible between 7.00% and 7.13%. Price previously reacted to this area, suggesting it is currently preventing further declines.
Resistance: The upper white line mentioned earlier acts as resistance, limiting short-term price movements.
Bullish Scenarios (Yellow Dotted Lines):
Continuation of Downward Channel: There is a high probability that the price will continue ranging within this downward channel before moving upward at an opportune moment and breaking the trendline.
Reaction and Exit from Channel: After exiting the dynamic white resistance line, the price is expected to rise up to the 9% level.
Important Notes:
Tether and the Market: When USDT dominance increases, it usually indicates that investors are fleeing to stablecoins like Tether and withdrawing from other cryptocurrencies. Conversely, a decrease in USDT dominance typically signals capital inflow into other digital assets such as Bitcoin and altcoins.
Indicator-Based Analysis: This analysis is based solely on the price chart. For a more comprehensive analysis, additional indicators such as RSI, MACD, and trading volume should be examined, which are not visible in this image.Summary: Currently, USDT is positioned within a key support range and is moving inside a downward channel. A breakout above the white resistance could be positive news for the market, indicating capital rotation out of USDT and into other cryptocurrencies. On the other hand, a breakdown below the green support may signal increased caution and potential capital exit from the market, making a bullish scenario for USDT more likely.
Support and Resistance Levels:
Key Support: A significant green support zone is visible between 7.00% and 7.13%. Price previously reacted to this area, suggesting it is currently preventing further declines.
Resistance: The upper white line mentioned earlier acts as resistance, limiting short-term price movements.
Bullish Scenarios (Yellow Dotted Lines):
Continuation of Downward Channel: There is a high probability that the price will continue ranging within this downward channel before moving upward at an opportune moment and breaking the trendline.
Reaction and Exit from Channel: After exiting the dynamic white resistance line, the price is expected to rise up to the 9% level.
Important Notes:
Tether and the Market: When USDT dominance increases, it usually indicates that investors are fleeing to stablecoins like Tether and withdrawing from other cryptocurrencies. Conversely, a decrease in USDT dominance typically signals capital inflow into other digital assets such as Bitcoin and altcoins.
Indicator-Based Analysis: This analysis is based solely on the price chart. For a more comprehensive analysis, additional indicators such as RSI, MACD, and trading volume should be examined, which are not visible in this image.Summary: Currently, USDT is positioned within a key support range and is moving inside a downward channel. A breakout above the white resistance could be positive news for the market, indicating capital rotation out of USDT and into other cryptocurrencies. On the other hand, a breakdown below the green support may signal increased caution and potential capital exit from the market, making a bullish scenario for USDT more likely.